4 min read
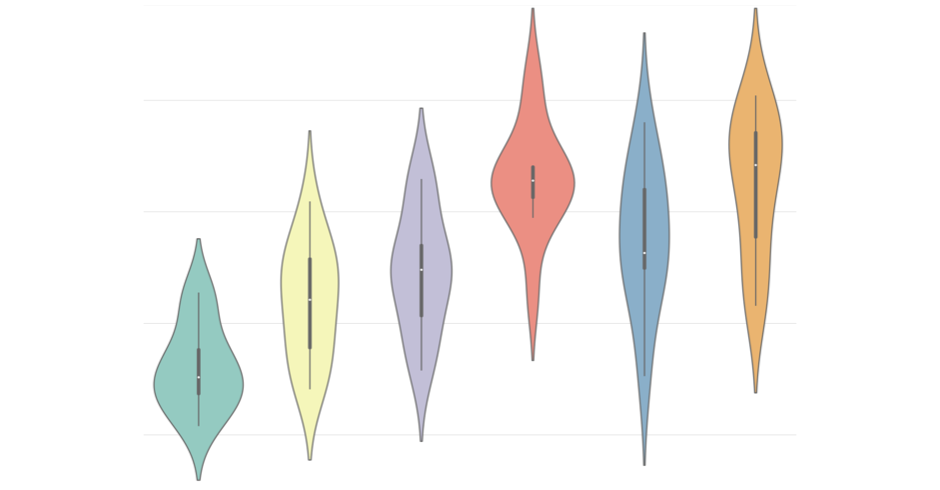
Violin Plots 101: Visualizing Distribution and Probability Density
View these Violin plot examples to learn what they are & how they work. Make Violin plots with tools like Python, R, Seaborn, Matplotlib, & more.
More Ways to Read:
🧃
Summarize
--
The key takeaways that can be read in under a minute
Sign up to unlock

Worth the squeeze
Get access to the condensed version of this piece, and every other article on The Juice by AudiencePlus, and so much more.
Start a free account on The Juice and we'll send you weekly emails sharing which podcasts, blogs, guides,
etc. are trending with other marketing or sales pros. We call it the Top 5!
Other content from
Mode


Featured by Simple Strat
